Frequently Asked Questions, Answers, and Opinions
We tackle a continually updated and expanded list of questions and market debates concerning the possible path of US interest rates, shape of the yield curve, implications for the economy, etc.
This Time is Different: Re-Assessing Long-term Strategic Asset Allocation
(Posted to Linked-In on April 21, 2025)
“This time is different” are words that shake the core of asset managers with long-term time horizons. When equities are one’s primary asset class, a long-term time horizon comes with a strong built-in bias not to make quick, large adjustments in the face of equity bear markets. History strongly suggests, eventually, equity markets return to growth and reach new highs. Sure, maybe make some defensive incremental adjustments, but wait-out the downturn is the prevailing mantra.
Short-term asset managers and hedge funds can’t afford a long-term do-little approach and have already made changes in their portfolios, just look at the market moves in equities, bonds, and the dollar. Unfortunately, way too many long-term asset managers are ducking the challenges and sticking their heads in the sand.
The message is that the profound policy shifts coming from the Trump Administration should not be ignored by those with long-term time horizons. Hiding behind the long-term mantra and changing the client conversation to focus on the incremental defensive adjustments one has made in the portfolio is unacceptable.
The US tariff war has been applied to every country, from close allies to geopolitical competitors. Economic relationships are not going to be as cooperative as before, especially among friends. And higher tariff regimes may mean less innovation and more inflation. The new US foreign policy of reducing support for Ukraine, threatening Greenland and Panama, talking about Canada as a 51st state has shaken NATO and clearly ended any semblance of the era of Pax Americana that ushered in decades of global trade growth. The immigration deportation policies have scared many international travelers away from visiting the US, and the numbers of non-US students planning to attend US universities in the Autumn of 2025 may significantly decline. And the latest Trump Administration jaw-boning the Federal Reserve has led to many in Planet Forex to fear the loss of relative independence of the Fed which has the potential to set in motion a long-term decline of the US dollar as the advantages of being the world’s primary reserve currency fade away.
Clients of asset managers should expect to receive thoughtful responses to questions about how all these profound narrative changes might impact a disciplined long-term asset allocation strategy. Increase non-US holdings? Reduce US dollar exposure? Reduce exposures to big tech due to tariff risks? Be wary of longer-duration fixed income if inflation and a weak dollar are possible? Avoid adding private equity given the heightened challenges involved with illiquid investments?
The right answers may turn out in hindsight to have done very little. Regardless of whether any action is taken, clients deserve a thoughtful response to how these narrative changes have impacted the investment process and not some sideways avoidance of the challenges by shifting to a discussion of the tactical and incremental moves being made in the portfolio.
In a hole, stop digging
(Posted to Linked-In on April 8, 2025)
“If you find yourself in a hole, stop digging!” – The wisdom of Will Rogers (1879-1935) suggests that it may take considerable time and volatility before we are sure that March-April 2024 stock market slide is over.
First, we may not have yet stopped digging the several holes impeding the US economy in 2025. Tariffs are a huge item, to be sure, but the extent of cuts to the federal government workforce and cuts to the federal government budget are also constraints on the economy. When you cannot tell if you have stopped digging, there is the overhang of uncertainty which financial markets hate.
On the tariff front, China and the European Union among others seem likely to impose their own retaliatory responses – not always tariffs – and then the US is likely to respond again. In the land of an eye-for-an-eye, many innocent people, companies, and countries may get blinded. Until we find a resting place for tariff rates in the new global protectionist regime which we have entered, there will be substantial uncertainty on how the economy will react, but less personal consumption and reduced corporate investment seem a given, even if we do not yet know the extent.
With regard to the downsizing of the federal government workforce and eventual budget cuts, we will have to wait for Congress. Budget resolutions are tangled up in raising the debt ceiling in a way that the resolution may not come until the summer. And while you might see tax cuts as partially offsetting some of the economic gloom, be careful. The main tax “cut” is likely to be only an extension of the 2017 tax legislation, which is not going to provide any meaningful stimulus to personal spending or corporate investment.
Second, finding bottom to this stock market decline is so hard since the Federal Reserve may not ride to rescue with lower short-term interest rates, as quickly as it did in 1991, 2001, 2008, and 2020. Because tariffs threaten higher inflation, if only for a few transition years, a data-dependent Fed may decide to wait until unemployment is clearly heading for 5%. (Please see my posts from March 30, 2025, on why the Fed is between a rock and hard place, and the post of February 4, 2025, noting that a US recession had become the base case for 2025.)
Third, the tariff battles, shrinking the government workforce, and federal budget cuts are all part of a seismic shift in everything from global supply chains to corporate investment to personal consumption habits. In effect, the global economy, not just the US economy, is experiencing a shock that will require significant re-wiring. As my friend John Rutledge points out, we are far from equilibrium. The physics of phase transitions suggest that the indirect effects may be even larger than the direct effects we are just starting to observe. It is likely to be a very bumpy ride before a sustained equity market recovery can even begin, at least until we are sure we have stopped digging.
Fed Independence is at Stake
(Posted to Linked-In on March 30, 2025
The Fed is Between a Rock and a Hard Place. Fed Independence is at stake The US economy is weakening, and inflation expectations are rising. Given the Fed’s dual mandate of encouraging full employment and price stability, these goals are now in conflict. Fiscal policy, including the firing of federal workers and shrinking of many federal agencies and departments has cast a pall over consumer sentiment. The escalating tariff war has moved into its tit-for-tat stage, and in the land of an eye-for-an-eye, many may be blindsided. With global supply chains being disrupted, goods prices are likely to be on the rise. Here are three things to consider concerning the Fed’s policy dilemma.
(1) Unemployment and Inflation data may not have equal weight in Fed’s eyes. The Taylor Rule suggests that the Fed weighs the unemployment and inflation components of its dual mandate equally – probably not! Many Fed governors and regional Fed presidents believe that a weakening economy will lead to decreased pressure on prices, so inflation may decline (with a lag) as unemployment rises. Consequently, if the economy weakens, even with tariff policy pushing up goods inflation for the next year or two, the Fed will look through the rising inflation expectations, deem them transitory, and move toward lower sharply short-term rates.
(2) Data dependency means the Fed will be late to respond to economic weakness. Monthly metrics through March 2025 shows continued strength in the US economy, however, it is the data reported in Q2 which is likely to show deterioration. Continuing claims for unemployment insurance are likely to creep higher as jobs become harder to find. Personal consumption expenditures may slow and government expenditures contract in Q2/2025. Yet the Fed’s key target, the unemployment rate, may only creep higher. Many of the workers leaving federal government service may not be immediately eligible for unemployment insurance. And the unemployment rate is a notoriously lagged indicator because companies stop hiring well before they shift to laying off workers, because layoffs can be costly if the downturn is short-lived. A data dependent Fed may need more and persistent evidence of rising unemployment, and hence delay and delay before lowering short-term rates.
(3) Fed independence is the long-term issue. How the Fed handles this episode could bear on whether it maintains its independence after Chair Jay Powell’s term runs out in the spring of 2026. President Trump is a vocal proponent of lower rates. Treasury Secretary Bessent has focused on lowering long-term rates. The bond market may not look though “transitory” inflation pressure as easily as the Fed’s FOMC or the Trump Administration. If long-term rates are sticky in the face of rising inflation expectations and the yield curve shifts to a significantly positive slope, will the Fed return to quantitative easing to push long-term yields lower? Fed independence and the US dollar could be casualties.

US Recession now the base case
(Posted to Linked-In on February 4, 2025
Probabilities that the US economy will soon enter a recessionary period are rising, have passed over 50%, and have become our “base” case scenario.
Over the last 76 years since 1949 in the US, there have been just 9 episodes (12%) with negative real GDP growth. Since positive real GDP growth occurs about 88% of the time, one has to have a really good rationale to anticipate a recession in the near future. We avoided forecasting a recession when interest rates rose in 2022 and the yield curve inverted by understanding that data-mined patterns also need context, and the post-pandemic was a period vastly different from previous episodes of rising rates or inverted yield curves. This time though, rates are off their peaks, if on hold, and the yield curve is positive, so why the pessimism?
Our worries are centered around how economies react to shocks in terms of the initial transition period before the long-run equilibrium arrives. There is a trade-off between shock therapy (ie, do it fast, rip off the bandage) versus gradual implementation of new policies. Shock therapy gets one to the anticipated more positive long-run equilibrium faster, but it comes with potentially much larger disruptions that can be quite painful for the economy in the short-run.
There are three potential shocks to the US economy on which we are focused, and they are intermingled and happening simultaneously.
(1) Trade war. When one country imposes tariffs other countries respond. In an “eye for an eye” environment, one can expect to get seriously blind-sided by some of the unanticipated negative outcomes.
(2) Labor market disruption. Mass deportation of illegal immigrants will hit agriculture, hospitality, and constructions sectors. Reducing the size of the federal workforce can send shock waves through employees, families, and neighbors, causing many people to cut back on spending until they can better assess their personal job security. Suspending selected government grants and contracts, even temporarily, also impacts the job security of many non-federal employees.
(3) Budget Cuts. Reining in federal government spending to reduce the long-run budget deficit is the objective. The transition, though, can be painful. GDP is the sum of personal consumption, investments, government spending, and net trade flows. Slowing the growth of federal government spending or, more aggressively, actually reducing expenditures, can be a serious drag on GDP.
Our bottom line is that major policy shifts involve transitional periods that can be highly disruptive. Rapid policy changes are now likely to tilt the US economy into recession in 2025 regardless of what the long-run equilibrium might bring. We expect weaker data to start arriving soon and recessionary data in the spring.

Coming Debt Ceiling Crisis to Delay Tax Cuts and Cause Turmoil
(Posted to Linked-In on December 10, 2024
Exceptional market turmoil may arrive in the summer of 2025 due to debt ceiling uncertainty. Passing any fiscal legislation to extend the 2017 tax legislation, possibly lowering corporate taxes, reducing government expenditures, etc., is going to be next to impossible until the debt ceiling issue is resolved.
With bi-partisan support, the debt ceiling was suspended until January 1st, 2025, to avoid the elections. The debt ceiling will go back into effect at the current level of US federal government debt, somewhere near $36 trillion. Given the powers of the US Treasury to move money around to delay the inevitable, the next debt ceiling crisis will arrive in the summer of 2025, and that is when market may get roiled by the political divisions within the Republican Party.
There is a group of limited-government Republicans in the House of Representatives that may not vote for a debt ceiling increase under any circumstances. Given the razor-thin majority the Republicans hold in the House, this means the final debt ceiling compromise may require Democratic Party support. That is, the debt ceiling challenge will hang over and delay every budget-related piece of legislation until resolved.
Resolving the debt ceiling crisis of 2025 is likely to be much more divisive and harder to manage than the episode in July-August 2011 that occurred under President Obama’s Administration. The 2011 episode resulted in a budget compromise that limited spending increases and resulted in a steady decline in budget deficits after the one-off large spending increase passed at the end of Bush Administration to help cushion the blow from the financial panic of 2008 that led to the Great Recession.
Also remember that the debt ceiling crisis of 2011 led Standard and Poors to downgrade the credit quality of US federal government debt, only to see US Treasury yields decline (prices rise) in a flight-to-quality movement during the crisis period. And, due to the risk of default, however small, any T-bills maturing in July and August may be avoided by those pensions and money market funds that have prohibitions against owning securities in default – even in technical default. Moreover, since we know that politicians can’t make tough decisions until there is a crisis or deadline, the shape of any compromise to avoid a default on US Treasury debt is impossible to anticipate. But if Congress wants to take their August vacation, they are going to need to make a deal.
This means that active traders, hedge fund portfolio managers, money market fund executives, etc., you get the point, should avoid planning vacations or exotic holiday travel, especially for July-August 2025, when the debt ceiling crisis will hit the fan and disturb markets.

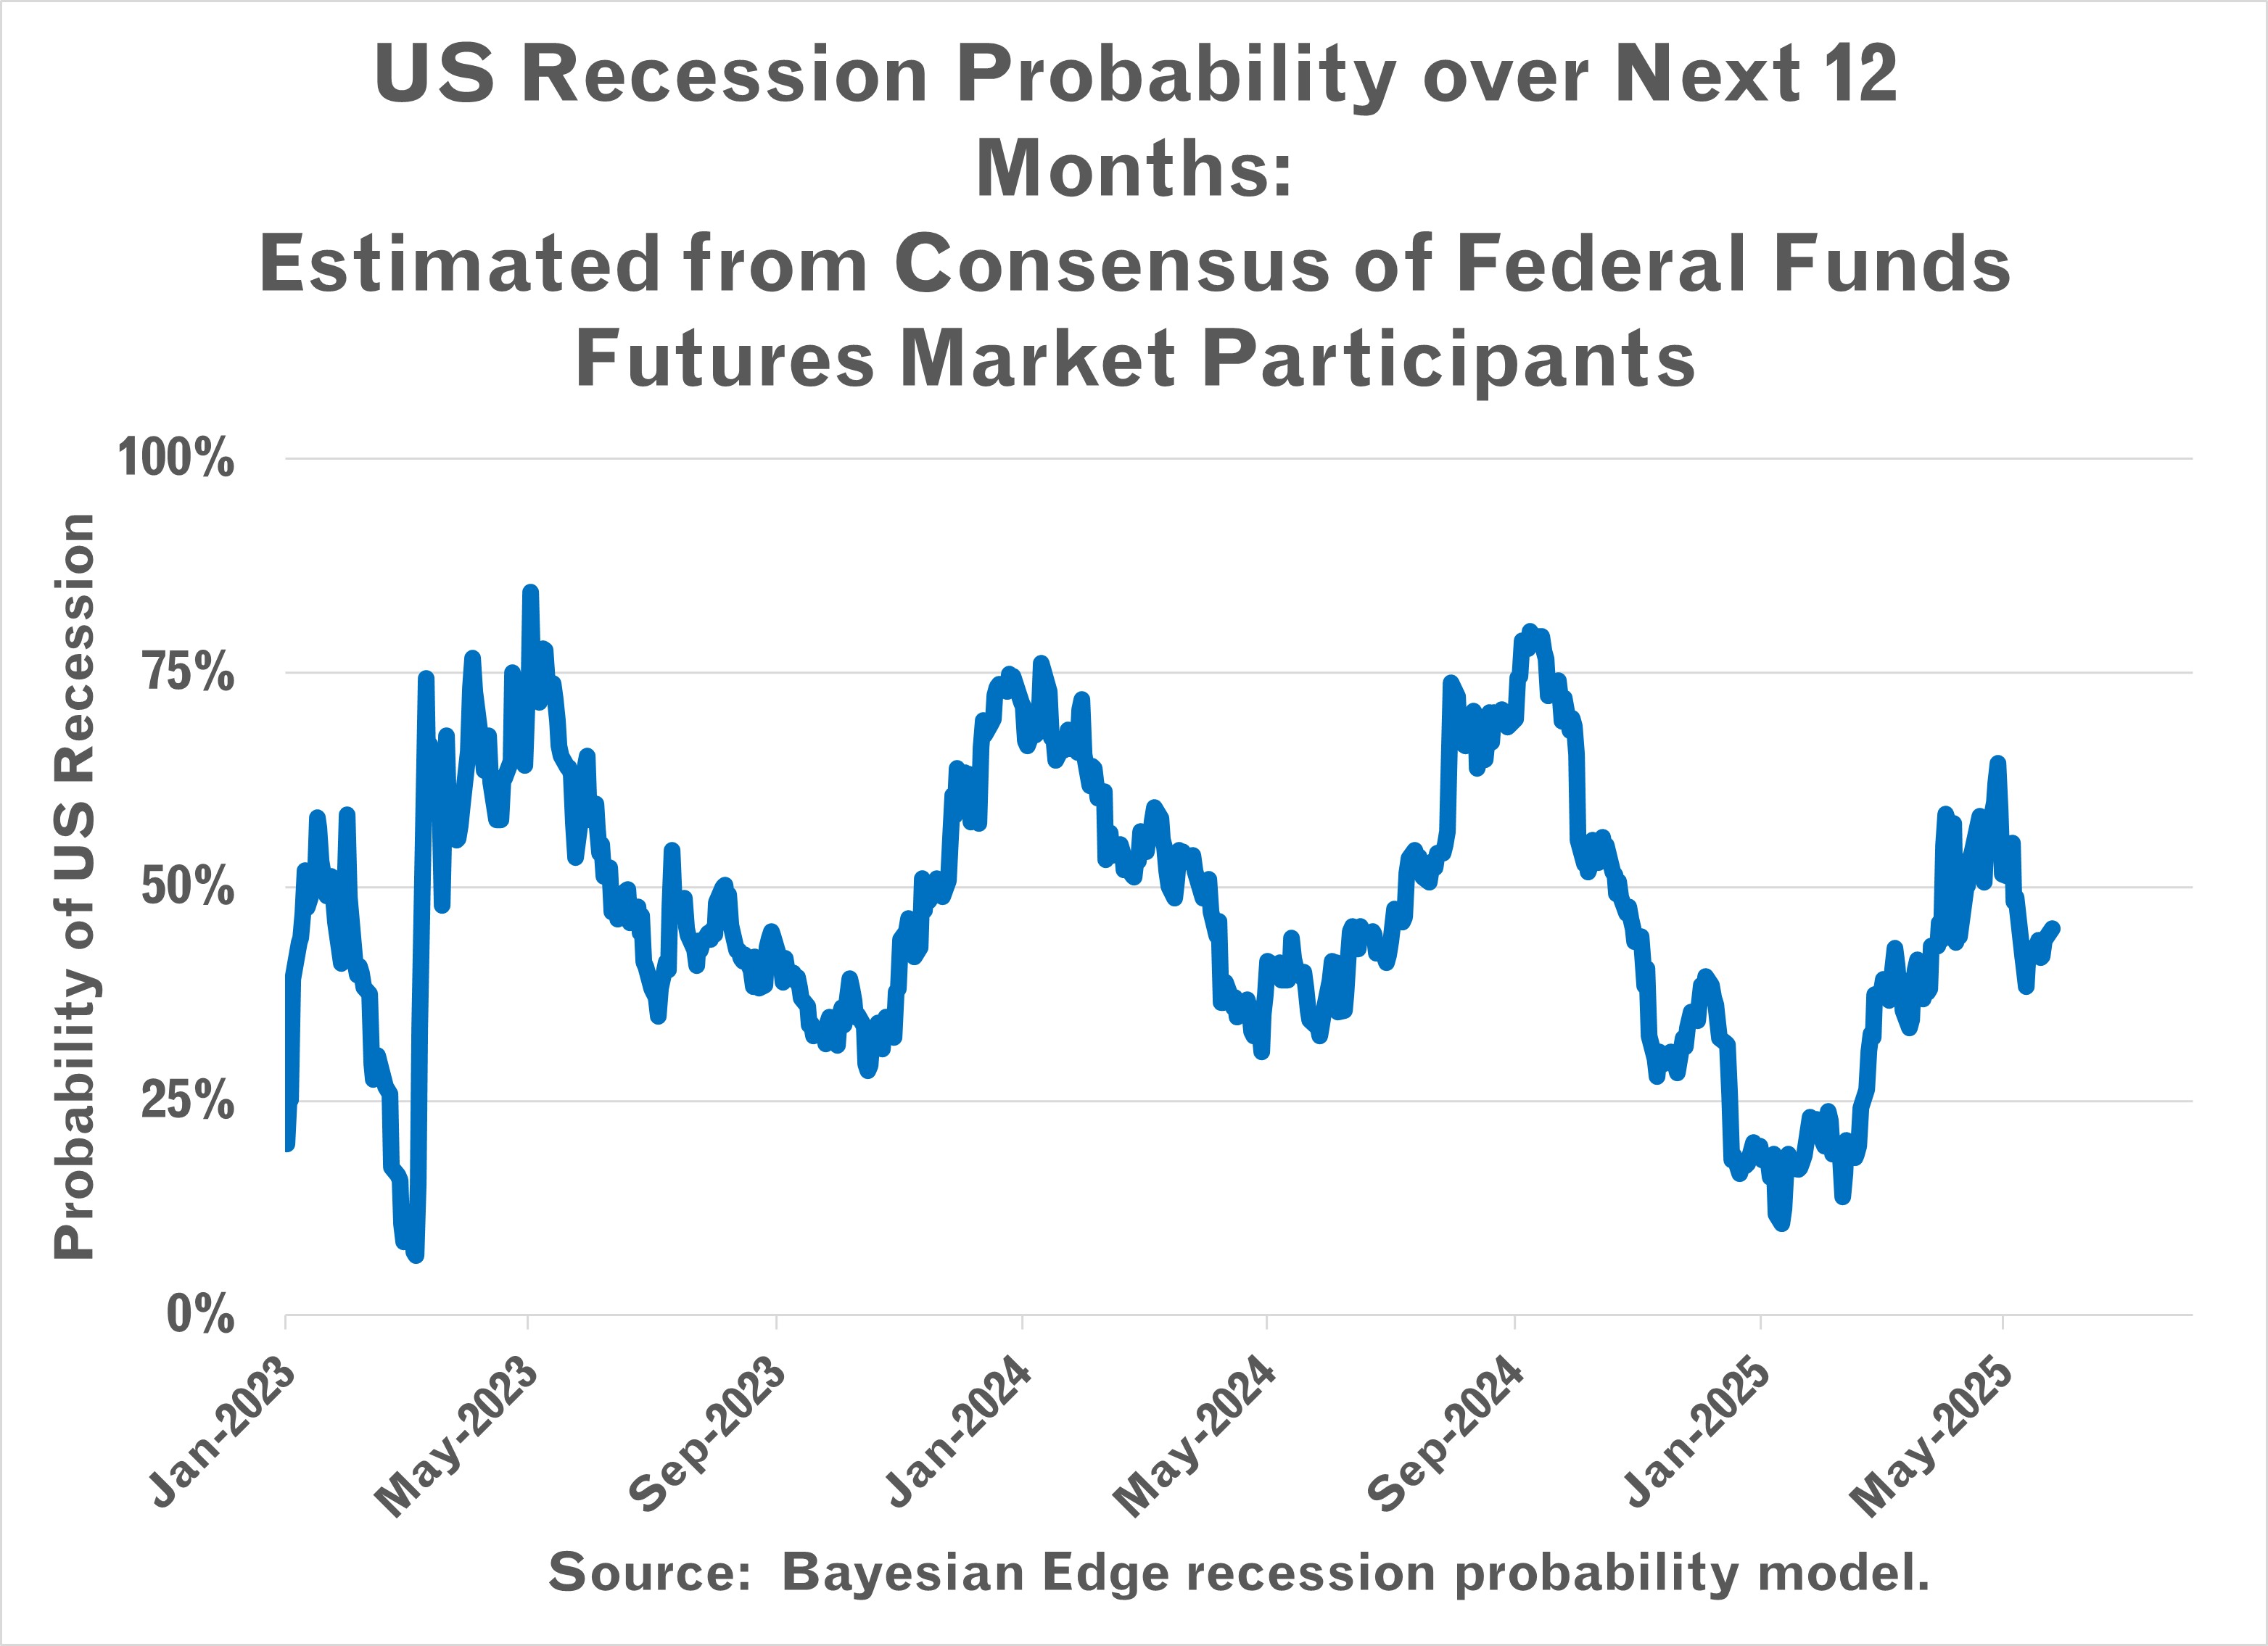
Hypothetical Recession Probability Derived from Federal Funds Futures
(Posted to Linked-In on December 4, 2024
Might it be possible to calculate what market participants think about US recession or no-recession probabilities from federal funds futures prices? Yes, although with a heavy burden of heroic assumptions.
Using our experimental method, as of the close on December 4, 2024, the probability of a US recession occurring before the end of 2025 was close to 20%. Back in late August and early September 2024, recession probabilities were over 50%. Since then, strong jobs data, steady consumption expenditures, and equity market bullishness after the Trump election victory have lowered market participants’ probabilities for a US recession in the coming year.
Warning: the consensus expectations of market participants are likely to be wrong and they move around with every new piece of information. So, be careful how one interprets this hypothetical analysis.
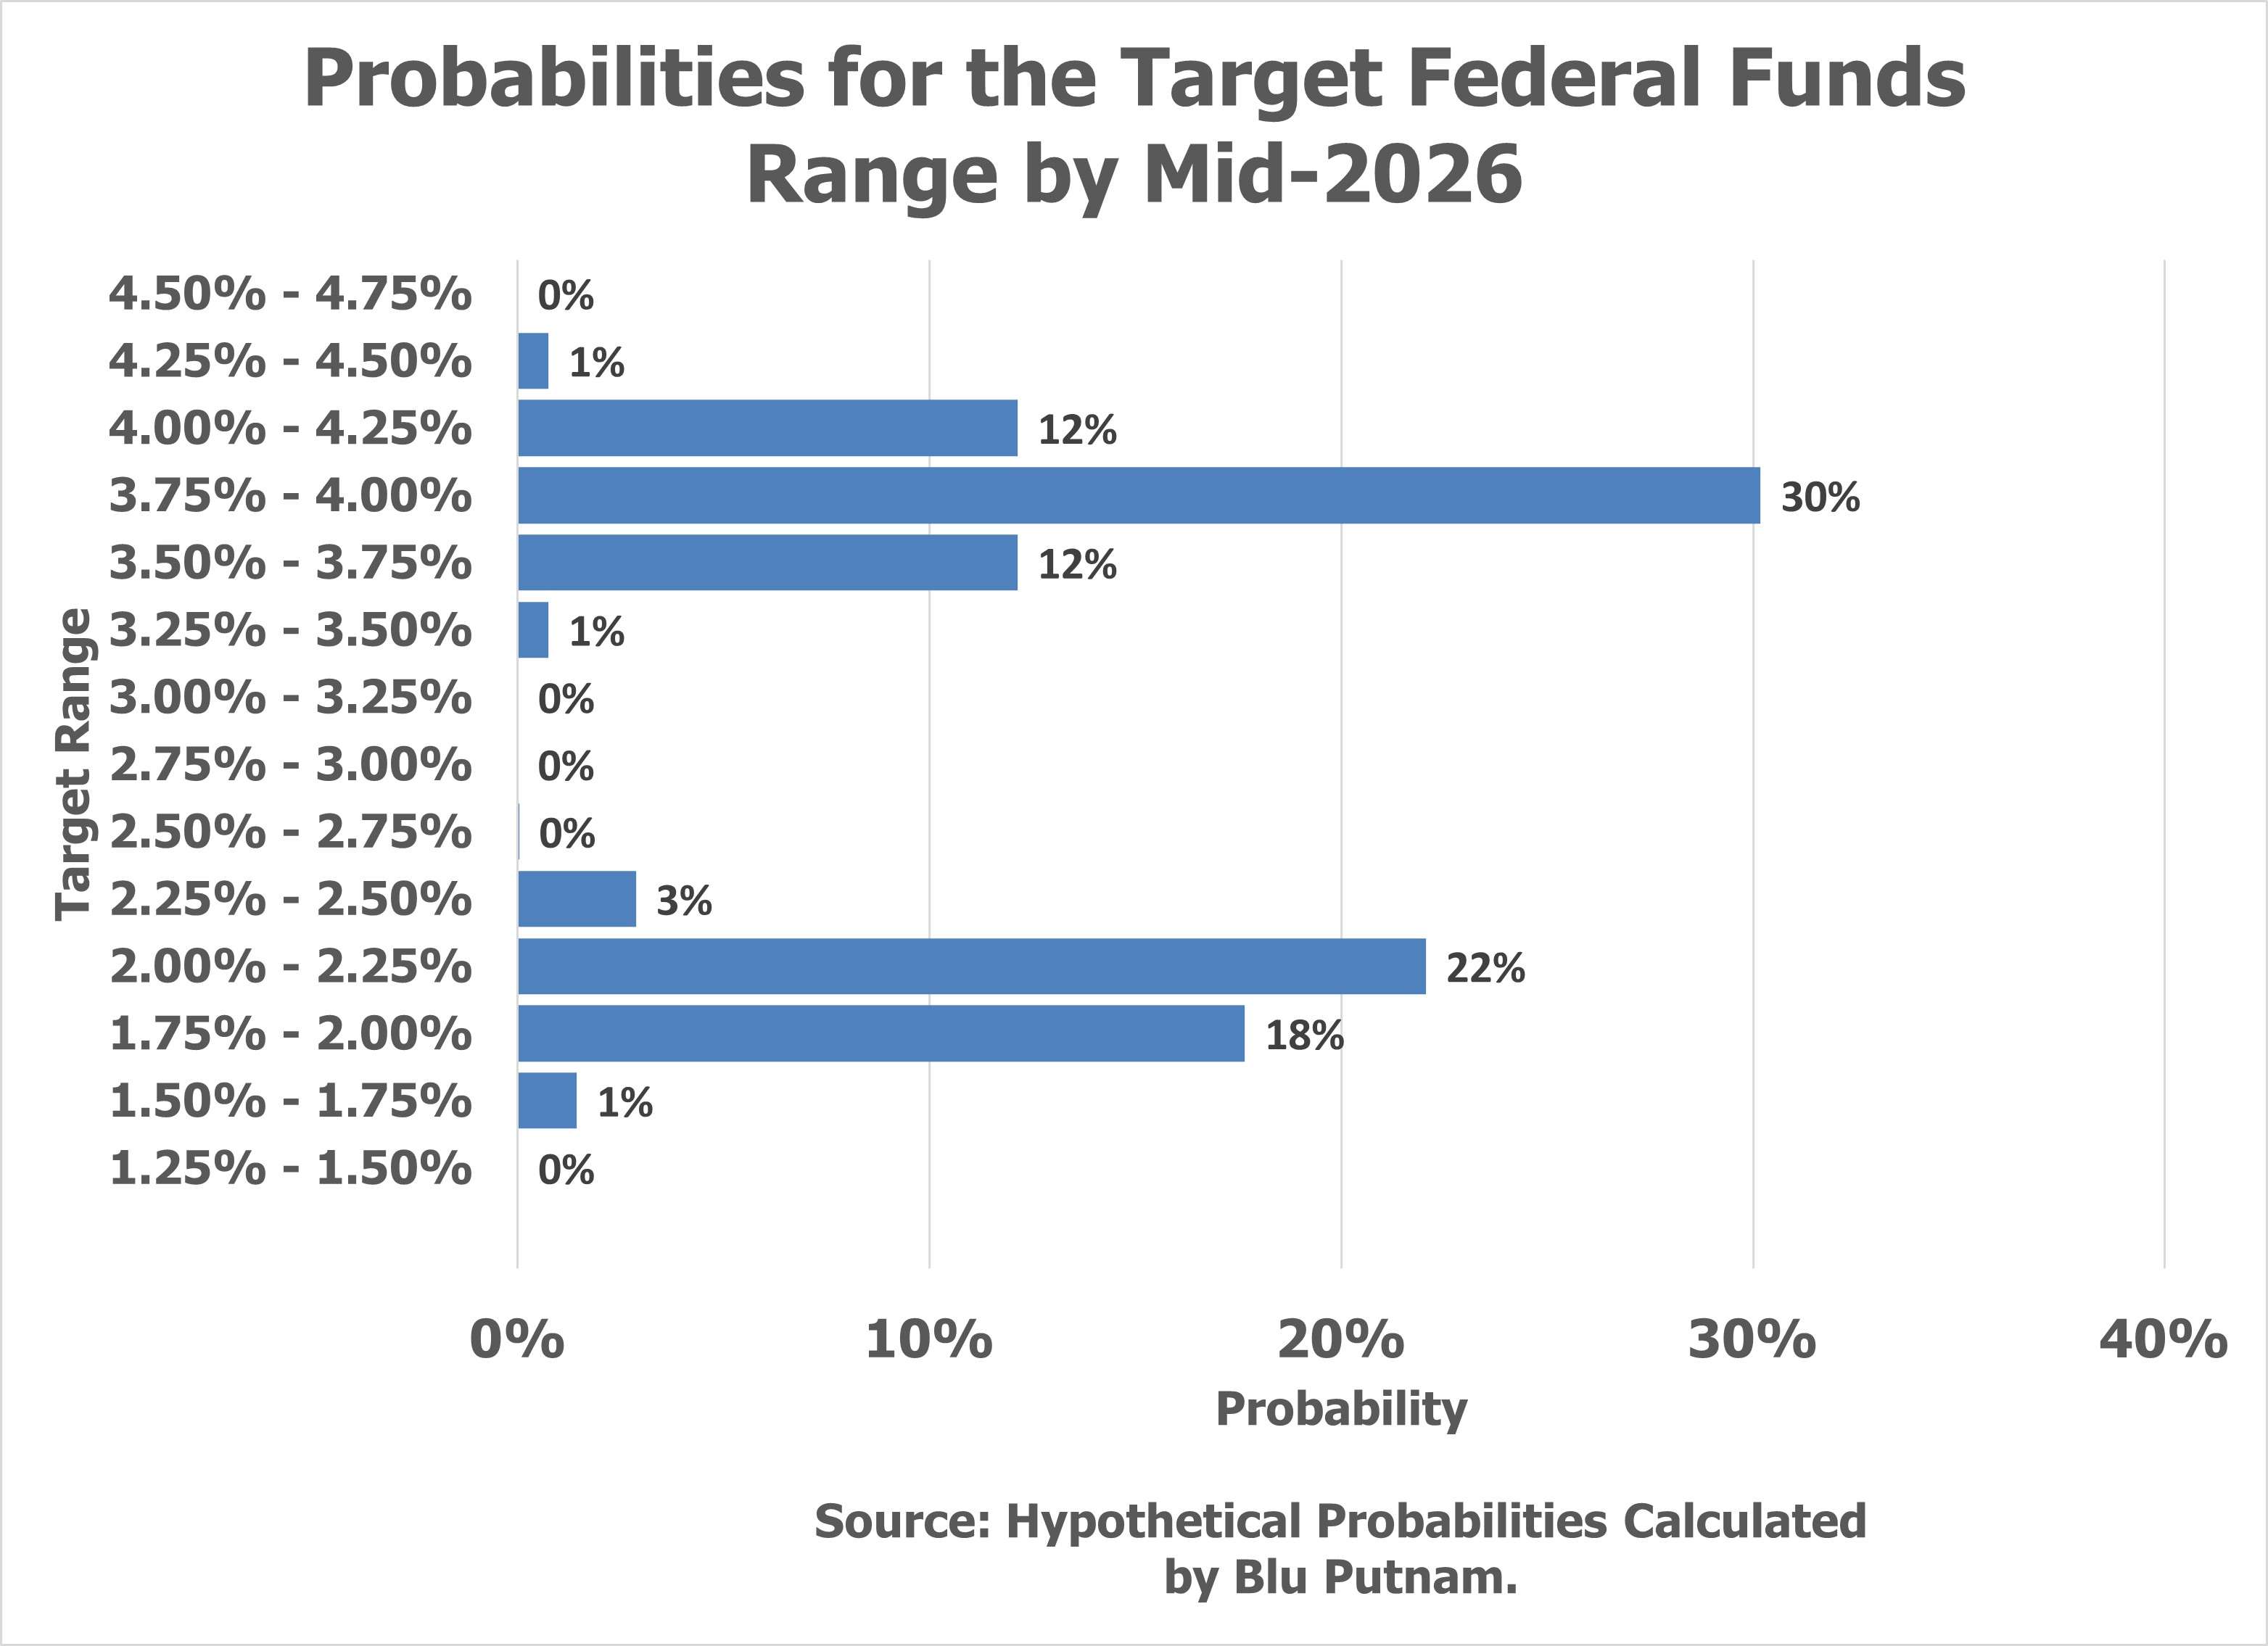
Now for the assumptions. We are assuming the federal funds futures prices should NOT be interpreted as the market expectations of the rate in the future, as is commonly done. We believe that there are two dominant scenarios, and the futures market is pricing the probability-weighted average of the two. Scenario #1 assumes no recession, inflation is sticky above the Fed’s 2% target, and the Fed is only willing eventually to lower rates to the 4.00% - 4.25% target range. Scenario #2 assumes a recession, inflation drops below 2%, and the Fed lowers rates to around 2% to stimulate the economy.
Only one of these scenarios (or maybe even some other scenario) will prevail, which is why we do not recommend interpreting the implied interest rate from federal funds futures as a point forecast when market participants are debating multiple scenarios. Futures market price the cost of hedging directional risk, which depends on the views of hedgers and speculators and how they assign probabilities to different scenarios.
Path of Rates and Shape of the Yield Curve?
(Posted to Linked-In on September 20, 2024
After the September 18, 2024, Federal Reserve rate cut, we have updated our views accordingly about evolution of the yield curve and the probable terminal federal funds rate in this cutting cycle.
(1) The Treasury 10-year Note has fully priced in assumptions of modest real economic growth, slower net new monthly jobs, possible slight increases in the unemployment rate yet no recession, and a little more progress on inflation approaching the Fed’s 2% target. This means the Treasury 10-Year yield is likely to be range-bound, possibly between 3.5% and 4.0% as it adjusts to incoming economic data, so long as that data is more or less in line with what has been currently factored into the yield. Translation: Longer-term Treasuries may earn their coupon, but price appreciation even with further federal funds rate cuts is not likely.
(2) While the long-term neutral federal funds rate (i.e., neither accommodative or restrictive) is a mythical concept, unobservable, and probably a moving target, we present two criteria for being able to tell when we have arrived at something like a neutral policy. First, we would expect the federal funds rate to reside a little bit above the prevailing rate of longer-term inflation expectations, which we currently put at about 2.5%. Second, we would expect the federal funds rate, and the 2-year Treasury yield to be below the 10-year Treasury yield (i.e., a positively sloped yield curve). We do not know what a data-dependent Fed will actually do, but this interpretation suggests a terminal rate for federal funds between 3% and 3.5%, with the 10-year between 3.5% and 4.0%. Of course, if there is a recession, then both the federal funds rate and the 10-year will likely go considerably lower.
(3) This brings us to our "débat du jour". Federal funds futures are often interpreted as an expected value at some point in the future. Currently, the end-2025 futures suggest by end-2025 that the Fed will have set its target range at 2.75% - 3.00%. We would argue that this rate is highly unlikely because we are in a two-scenario environment (i.e., modest growth versus recession) either of which would produce strikingly different outcomes. In a two-scenario world, the market is likely to price the probability-weighted value of each scenario. When one scenario wins the day, the probability shifts to 100% for the winner and the federal funds rate would move accordingly. If the modest growth scenario holds through 2025, then an end-2025 federal funds rate target range might be 3.25%-3.5%. If a US recession develops in 2025, then the end-2025 target range might be more like 2.0%-2.25%.
(4) How does one identify a two-scenario market environment? Study longer-dated options and examine tails of the strike price distribution of open interest. We would argue that SOFR, Treasury, and Equity options currently reflect the debate about the future path of the federal funds rate being highly dependent on whether a recession occurs or not.

Fed to cut rates, but by how much?
(Posted to Linked-In on September 11, 2024, slightly revised on Sept 12)
With only a week to go before the next Federal Reserve rate-setting FOMC meeting, CME’s federal fund futures are ambivalent between a 0.25% and 0.50% rate cut. As of the close on September 10, CME’s FedWatch Tool suggested there was 70% probability of a 0.25% rate, and 30% for a 0.50% cut. By the morning of September 11, there was 85% probability of a 0.25% rate cut, and then at the close on September 13, it was suggesting 55/45 odds on a cut of 0.25% versus 0.50%.
This much uncertainty and volatility just before an FOMC meeting has been highly unusual since Fed Chair Bernanke embraced forward guidance after the financial panic of September 2008 and the Great Recession that followed. With forward guidance, the Fed is trying to avoid surprising market participants on the day of the rate decision. This time there is some real controversy.
Federal funds futures are more complex than they might appear on the surface. Perhaps, this might be a good time to dive into the weeds. Many futures contracts are settled at the ending price on a specific day. For example, the S&P E-Mini futures contract for September 2024 will settle at the closing index value September 20, 2024, the third Friday of the month. Not so for federal funds futures.
Federal funds futures close on the last calendar day of the month based on the average daily interest rate, including weekends, as calculated by the Federal Reserve Bank of New York. Using the daily average over the whole month adds a layer of complexity. When the FOMC meeting occurs in the middle of the month, as it does in September 2024, there will be 17 days at the current effective funds rate, which has been averaging about 5.33%, and then there will be 13 days at the new rate. It sounds like an easy calculation, except federal funds rates do not always trade exactly at their average rate every day. Corporate tax payment days can occasionally disturb the rate for a day or two. Quarter endings also can sometimes see federal funds trade away from their typical average.
A modestly simpler approach is to note that October 2024 does not contain an FOMC meeting, and October is not a quarter-ending month, so this is a relatively “clean” month, so to speak, since no rate changes are likely to occur without an FOMC meeting. Note that Fed funds futures are quoted in prices, so the rate is implied. When the rate decision is announced at 2pm New York time on September 18, the federal funds futures will immediately move to reflect the decision, as will other related markets, from Treasuries to equities, to gold, to FX.
Get ready for more than the usual excitement when with the release of the FOMC press release on September 18. And there will be considerable attention paid to the press conference concerning the pace of future rate cuts. Federal funds futures by end-2025 suggest a terminal rate close to 3%, which implies a steady 0.25% cut at virtually every FOMC meeting well into 2025. Just remember, a gradualist Fed takes the stairs down unless a recession hits, in which case the Fed quickly pushes the ground-floor elevator button. We don't think hitting the panic button will be necessary this time around, but it remains a risk.

Mis-Forecasting a US recession: Real Life Lessons in Data Mining
(Posted to Linked-In on August 20, 2024)
The historically most accurate forecaster of US recessions – an inverted yield curve – and the most accurate forecaster of identifying entry into recessions – the rapidly rising unemployment rate rule (i.e., Sahm Rule) – have both failed. OK, for some of you, the jury is still out, so perhaps I am jumping the gun, but the US economy is not in a recession, not yet anyway, and during the whole rate-rise phase I have studiously avoided ever making a recession my base case.
My point in this post is that the dangers of interpreting data-mining patterns without considering the context are on full display in the markets.
Recessions are characterized by a systematic disruption that dominoes through the economy and leads to rapid rises in unemployment. The yield curve has sometimes served as a trigger for a systematic disruption. For example, rising short-term interest rates and the inversion of the yield curve helped to trigger defaults in the sub-prime mortgage market, which led to further troubles for some major investment banks and insurance companies, and then the financial meltdown in September 2008. Or, back in 1990, the inverted yield curve spelt big troubles for the Savings & Loan Institutions that borrowed short-term from individuals and lent long-term for home mortgages and for high-yield corporate debt, all without hedging their interest rate risk. The demise of the S&L sector spread to an economy-wide recession.
The point is that an inverted yield curve in and of itself is not sufficient to cause a recession. For a recession to occur, the inverted yield curve must cause severe financial distress for key parts of the financial system, which then implode and lead to systematic disruption and widespread unemployment.
This time around, the yield curve inverted in 2022 and has remained inverted, but there has been no US recession. There almost was one. Certain regional banks and financial institutions had taken large speculative risks on Treasury bond yields staying low. The headliner was Silicon Valley Bank (SVB) which exploded, but a number of other banks and financial entities were damaged as well. The resulting pullback in regional banks might have caused a recession, except that the regulatory community quickly built a firewall and made sure there was no systemwide financial disruption.
If you are going to forecast a recession because of an inverted yield curve, you should specify which sectors are likely to implode from taking too much interest rate risk. Note that with modern interest rate risk management, the US economy is much less interest rate sensitive than it once was.
The Sahm Rule involving a rising unemployment rate also needs context. Historically, when the unemployment rate starts to rise rapidly, typically the economy is losing jobs. This time around, with the post-pandemic job surge, the unemployment rate went extremely low, then moved higher triggering the Sahm Rule, yet all the while, the US economy was still creating net new payroll jobs and personal consumption growth remained in positive territory.
There are a few lessons. Data-mining for repeatable patterns can lead one to trust the indicators more than one should without considering the context. Data patterns should not be interpreted as causal without having a solid theory to support the conclusion of causality, and that was not present in the current case for either the inverted yield curve or the Sahm Rule. (FYI – Dr. Sahm has dutifully warned about over-interpreting her rule.)

More volatility may arrive with the September 6 jobs report
(Posted to Linked-In on August 13, 2024)
Hang on tight. Equities, Treasuries, and Fed rate expectations may get another jolt on September 6, when the US jobs data for August is released. There is a good case to be made that the weaker than expected July jobs data was modestly suppressed by Hurricane Beryl. And the jobs data zigs and zags considerably, so an upward bounce into the 150,000 to 200,000 net new jobs territory gets a 65% probability. Any print north of 150,000 might cause many market participants to dial back their Fed rate expectations for the September 18 FOMC meeting to just a 25-basis point (0.25%) cut and possibly delay the anticipated pace of rate cuts for the rest of 2024 and into 2025.
In the same vein, it does not appear that the US is entering a recession, even if the economy may be slowing from its post-pandemic job surge and the infamous Sahm Rule has been triggered. That is, context matters. The Sahm Rule forecasting a recession based only on the rising path of the unemployment rate should not be taken at face value when net new jobs are still being created and personal consumption is growing at a positive rate, if not as strong as last year. Also, starting points matter, and the low point for the unemployment rate of 3.4% back in April 2023 was historically low due to the post-pandemic job surge. The subsequent upward path to the current unemployment rate of 4.3% is more about the economy finding its post-pandemic equilibrium consistent with a 2% real GDP path than signaling that the US has entered a recession.
Finally, Fed policy is currently restrictive, which the Fed acknowledges. The Fed certainly could have started cutting rates earlier in 2024. Yet in analyzing the impact of interest rates, one needs to consider that the US economy is not remotely as sensitive to upward interest rate shocks as it was in the 1950s, 60s, 70s, and 80s. The US is no longer a rate-sensitive manufacturing economy anymore, and the growth and sophistication of interest rate risk management has surged since the introduction of electronic trading of interest rate futures and options in the late 1990s. For sure, some financial institutions were wrong-footed, but the overall systematic risk related to interest rate hikes and the impact on jobs is much lower than it once was. Given that the pandemic inflation surge has passed, the Fed is probably late to the task of rebalancing policy, yet there may be only limited consequences for the economy. And any lift to the economy in the future from modestly lower short-term interest rates may be hard to spot.


Is US monetary policy restrictive? Sufficiently restrictive?
(Posted to Linked-In on July 8, 2024)
Two standard definitions of a restrictive monetary policy are generally used by economists. Both currently check the boxes for a clearly restrictive policy. Yet there is significant controversy over the question of how restrictive actually is monetary policy, or as Fed Chair Powell likes to put it: "Is policy sufficiently restrictive?" We will go first to our definitions of a restrictive monetary policy, and then we will delve into the debate about what is or is not sufficiently restrictive.
A monetary policy is typically deemed as restrictive when one or both of the following criteria are met. Are short-term interest rates clearly above longer-term expected inflation or the prevailing inflation trend? Is the government debt yield curve inverted where short-term rates are higher than long-term bond yields? Currently, the answer to both of these questions is "Yes". US monetary policy is restrictive, but is it sufficiently restrictive?


We have to ask: sufficiently restrictive to do what? When the Fed talks about sufficiently restrictive they appear to have two related concepts in mind. Their ultimate objective is have inflation as measured by the PCE core inflation rate (which excludes food and energy) come back down to their 2% target rate. When Chair Powell discusses the topic of sufficiently restrictive, however, he is not just talking about inflation; he is talking as much or more about the economy and labor markets. That is, the implication is that unless real GDP decelerates or the unemployment rate rises, policy may not be sufficiently restrictive eventually to bring inflation down to the desired target. And the unemployment rate has been at the historically low rate of 4% or lower for a long time with no reaction whatsoever to higher interest rates and an inverted yield curve.
There are some things worth unpacking in this typical view of restrictive policy. The Fed view, shared by many, is that monetary policy may not be sufficiently restrictive unless there is pain seen in the economy in terms of rising unemployment. Back in the fall of 2022, Chair Powell was regularly warning that some pain in terms of rising unemployment would be a consequence of rising rates and was necessary to get the inflation rate back down to the 2% target. Headline CPI inflation came down from a 9% peak in June of 2022 to close to 3% by the end of 2023, with unemployment remaining at 4%. So, disinflation can certainly occur without sharply rising unemployment or a recession. The US economy has over time become significantly less sensitive to rising interest rates than was appreciated or understood by the Fed and many economic pundits and analysts.
Some members of the Fed's FOMC and a number of other analysts also seem to worry that if interest rates are cut too soon, that could ignite inflation again and so the rate cuts would have to be reversed. We would like to point out that this is highly unlikely as long as monetary policy continued to meet the definitions of a restrictive policy. Put another way, two cuts in rates of 0.25% each would bring the federal funds target range down to 4.75% to 5.0%. With inflation by every metric running close to 3%, and by some metrics lower, and with the 10-Year Treasury note yielding between 4.2% and 4.6%, the yield curve would remain inverted, although probably with a less steep downward slope as the 1-year and 2-year rates declined with the rate cuts. The bottom line here is that a few cuts in rates would mean policy would be less restrictive, but policy would by no means have moved into the accommodative territory where one might worry about causing higher inflation to return.
Where does this leave us? Confused. For the Fed, there is no clear answer to the sufficiently
restrictive question.

What data, more than anything else, caused the Fed to back away From rate cuts in 2024?
(Posted to Linked-In on July 2, 2024)
If you want to appreciate the data-dependent Fed’s dilemma about if and when to reduce its federal funds rate target range, the chart of the last six months of PCE core inflation when annualized says it all. Annualizing the rate of inflation based on just the last six months of data can provide a little more confidence that the downward trend in year-over-year inflation rate can be sustained.

In 2023, this metric was falling fast, even dipped just below a 2% reading at the end of the year. And, so toward the end of 2023, many FOMC members and Chair Powell became much more optimistic that rate cuts were going to be possible in 2024. The federal funds futures market moved from expecting just 2 rate cuts in 2024 after the mid-September 2023 FOMC meeting to expecting as many a 6 cuts in 2024 at the beginning of 2024. That shift in expectations was short-lived, because the month-over-month data started ticking higher in the first half od 2024 and bounced back up to a 3% annualized inflation rate. That is all it took for Chair Powell to become much less confident of the path to a 2% target inflation rate. The futures market agreed, and we are back to looking for just one or maybe two cuts in 2024 as we enter the second half of the year.

It is worth noting that to achieve a 2% annual inflation rate, the month-over-month increases have to average 0.167% a month or less, and that is just not happening yet. This data is noisier than most casual and some professional observers appreciate. That said, absent a recession, PCE core inflation seems to be settling into the 3% territory, which will leave the Fed in a quandary. The Fed has observed that policy is restrictive by most measures, but is it restrictive enough to get inflation down to 2%? Confidence is clearly lacking and the 6-month annualized inflation data explains why.
The US yield curve inverted; why didn't the economy go into a recession?
When the US Treasury yield curve moves into an inverted state with short-term rates higher than long-term yields, the US has typically experienced a recession. Indeed, most economists consider an inverted yield curve as the most reliable recession forecaster, bar none. The yield curve, however, is notoriously vague on timing. 12-18 months can easily pass before a recession kicks in. But we have been in an inverted yield curve shape for 18 months and more; there has been no recession, so did the yield curve get it wrong this time?
Actually, we give the yield curve considerable credit as a forecaster, even if the US has not had a recession. The credit comes because the US almost had a recession, but the falling dominoes were stopped in their tracks by quick and massive regulatory action. We are talking about the Silicon Valley Bank (SVP) episode in the spring of 2023.
The first concept to appreciate is that recessions are not so much caused by an inverted yield curve. The inversion of the yield curve triggers a problem for some companies and sectors of the economy whose business models depend on short-term rates being lower than long-term yields or at least that long-term yields do not rise significantly (i.e., prices fall). That is what nailed SVP. It had a made a huge and risky bet that long-term Treasury debt yields would not rise by much. SVP, and a number of other financial institutions, had parked large holdings of longer-term US Treasuries in their "hold to maturity" account. The "hold to maturity" account is not to be traded. The worst case is supposed to be that one holds the bonds to maturity and one gets par value back. Unfortunately for SVP and a few others the bond sell-off was significant enough for stock analysts and investors to notice the losses being accumulated, even if they were not required to be marked to market -- i.e., to show the extent of the losses. Compunding the problem for SVP was that it did not have a reliably sticky deposit base, so when people and companies began a run on the bank, it was all over. It was the problem of not having reliably sticky consumer deposits that hit a number of other regional banks, and several had to be merged with larger banks to survive. The financial regulator community came together quickly to make sure the contagion potential did not spread beyond a handful of regional banks. So what could have dominoed through the financial system and led to widespread runs on otherwise solid banks did not occur.
As a final note, it is worth purusing past recessions to observe that while an inverted yield curve typically occurred before the recession, it was a major disaster that actually caused the recession, triggered by higher rates and an inverted yield curve. As the US economy has become less interest rate sensitive (a theme that appears in several of our short commentaries), it becomes critical for forecasters to identify what sectors of the economy could get into enough trouble to cause a systematic disaster across the whole economy. We think a widespread run on regional banks could have done it. We do not believe the problems in the downtown commercial office buildings will cause a recession; just individual problems dispersed over time. And, the yield curve would not get credit for the downtown commercial office space troubles, because it was caused by the pandemic and shift to work home (WFH), not from higher rates.

Has the capital allocation process been distorted by mis-placed monetary policy?
Distortions to the efficiency of capital markets have real costs. Central banks do not seem to appreciate how mis-placed monetary policies can do damage to the capital allocation process; both when short-term interest rates are too low or too high.
With very low short-term rates, capital is relatively inexpensive, bond yields are pushed to unusually low levels, home mortgage rates are low, equity markets boom, private companies have easy access to cheap capital. Interestingly though, the economy does not grow any faster because many sectors feel pain and restrain spending. The losers are harder to identify and quantify, but they are no less real. Retirees and other people that depend in part on income from savings will be hurt badly and have to make spending reductions. Certain financial firms whose business models depend on cash rates earning a positive return relative to inflation may be seriously disadvantaged. This would include, for example, money market funds or independent brokers who gain from the interest on the margin accounts they hold. Investors, both individuals and institutions, are incented by too low rates to take more risk than they probably should, with consequences in the longer-term.
And it works in reverse, too. When short-term interest rates are pushed above the prevailing rate of inflation and above longer-term bond yields (i.e., an inverted yield curve), businesses that depend on short-term rates being lower than long-term yields are not as profitable or may even lose money, have to cutback, or go bankrupt Relatively high borrowing costs can reduce long-term investment and disrupt the orderly functions of the housing market. Private companies will find it harder to finance growth.
Yet there are winners, too, that provide significant support for the economy. Most importantly, cash becomes a valued asset, throwing off income that can be spent, which helps retirees and many endowments and foundations. And the inverted yield curve provides a strong incentive to hold cash in portfolios, potentially reducing risk-taking below a more desirable long-term path to encourage economic innovation and productivity gains.
Unfortunately, monetary policy as conducted by most major central banks is hyper-focused on inflation targeting. And this focus on a specific inflation target is paired with attention to labor markets, which are viewed, not necessarily correctly (another discussion), as a source of inflation pressure when they are growing at a healthy pace.
Central banks often have the perspective that inflation is essentially a monetary phenomenon. Since the central bank controls monetary policy, the logic is that a central bank should be able to target a specific inflation rate. Take the Federal Reserve’s policy statement as an example:
...“The inflation rate over the longer run is primarily determined by monetary policy, and hence the Committee (FOMC) has the ability to specify a longer-run goal for inflation. The Committee reaffirms its judgment that inflation at the rate of 2 percent, as measured by the annual change in the price index for personal consumption expenditures, is most consistent over the longer run with the Federal Reserve’s statutory mandate. The Committee judges that longer-term inflation expectations that are well anchored at 2 percent foster price stability and moderate long-term interest rates and enhance the Committee’s ability to promote maximum employment in the face of significant economic disturbances. [Source: from the Federal Reserve’s FOMC Statement on “Longer-Run Goals and Monetary Policy Strategy” adopted effective January 24, 2012; as reaffirmed effective January 30, 2024.”]
Modern economies simply do not work like that anymore, as economies are much less sensitive to interest rates while capital markets remain highly rate sensitive. Manufacturing-dominated economies of the distant past have morphed into service-dominated economies. Certainly, one often borrows money to buy a car or a house, but autos and housing no longer dominate a service sector-led economy. And, the sophistication of interest rate risk management has vastly improved over the decades. Financial futures only came into existence in the 1970s and only became institutionalized into the risk management processes of financial institutions during the 1990s after the savings and loan debacle in the US.
What we can see clearly is that many non-monetary factors that central banks have no control over whatsoever can impact inflation, not just in the short-run, but also in the long run. Take supply chains and globalization. From the 1990s into the 2010s, world trade benefitted from “pax Americana” allowing for supply chains, for the most part, to ignore geo-political risks. And there was a general movement away from tariffs and the formation of regional trade groups. All of this allowed companies to optimize their supply chains for the lowest cost, and this ushered in a “just in time” philosophy of managing inventories. Fast forward to the present. Geo-political risks are highlighted, the influence of the US on global politics has been downgraded. The pressure to raise tariffs and create trade barriers is on the rise. Companies are re-thinking their supply chains with the new objective of “just in case”, and they are looking to increase resiliency over lowest cost. Our perspective is that globalization and supply chains being optimized for the lowest costs was a major factor in the two and half decades of subdued inflations experienced in the US, as well as in Europe and Japan, over the 1994-2020 period. This era is gone. The influence on longer-term inflation is for higher, not lower inflation.
What does this mean? For US inflation, getting back to 2% using the standard inflation metrics is going to be a struggle, except during a recession when inflation might temporarily decline only to return in recovery. Our base case is that the US is now in a 2.5% to 3.5% long-term inflation path. Put another way, the idea that the conduct of monetary policy is like adjusting a stereo system to get the perfect balance of sound makes no sense in today’s economy. The longer-term health of the economy might best be served by paying more attention to the smooth and efficient functioning of capital markets, which argues for the maintenance of a modestly positive yield curve, with short-term interest rates anchored by central bank policy above (not below as in the 2010s) the prevailing level of inflation expectations. The interest rate uncertainty created by a data-dependent central bank trying to hit an elusive inflation target is not helpful for the long-term health of the capital allocation process which underpins the success of a modern capitalistic society.
Before the pandemic, US inflation averaged close to 2% for over 25 years; How likely is it for inflation to return to 2% and stay there?
Not all that likely. During the 25+ years that PCE core inflation stayed in a range from 1% to 3%, there were ups and downs in unemployment, a tech wreck on Wall Street, a subprime mortage crisis, interest rates went up and down. In short, something other than monetary policy was the primary cause of the two and a hlf decades of subdued inflation.

Our primary candidates for setting the overall context for subdued inflation are all related to globalization. With the fall of the Soviet Union, the era of pax Americana was in control. You could put your factory almost anywhere in the world (not everywhere) and not worry about geo-political tensions. There was a political wind blowing in favor of freer trade with no pressure to raise tariffs. Supply chains were optimized for the lowest cost. Importantly, all of these factors have disappeared or are in reverse. Geo-political tensions have exploded, and the US is simply not as strong or as politically committed to serving as the world's policeman as it once was. The political wind is blowing in favor of tariffs and away from freer trade. Tariffs are almost always inflationary. They are a tax on consumers, and consumers usually end up with most of the burden, although corporate profits may get squeezed some as well. Supply chains were disrupted by both the pandemic and geo-political events. Supply chains are no longer being optimized for the lowest cost. Instead, supply chains are being optimized for resiliency and dependability. This shift away from the lowest cost supply chains does not come free or even cheap.
A secondary impetus to keeping inflation subdued was the rapid expansion of the Internet, the arrival of on-line shoppoing. There was a shift in pricing power away from corporations and toward consumers given their newfound ability to comparison shop.
When we put it altogether we conclude that the odds of returning to a (more or less) 2% Inflation regime in the US are very low. Sure, if there is a recession, demand will fall (by definition) and inflation may be curtailed for a few years, only to return with the eocnomic recovery.
Notice that this argument is independent of monetary and fiscal policy. If fiscal policy takes another turn toward expansion and is supported by low interest rates and quantitative easing, which limits the impact on long-term yields of all the new debt issuance, then inflation could trend higher than 3%. An era of highly restrictive fiscal policy couple with positive real interest rates could produce lower inflation and get the US back to 2%. We would not count on this policy mix.
Inflation peaked at 9% in mid-2022 and by the last half of 2023 was back into the 3% territory; Where does the credit go?
We give the credit in roughly equal measure to three players. As you will see, our analysis is based on the wisdom of Will Rogers, who observed that if one wants to get out of a hole, then stop digging. All three of the primary factors causing the inflation surge were fully reversed by 2022, and guess what? Inflation peaked in 2022, and declined rapidly throughout 2023.
The supply chain disruptions of the pandemic were largely resolved by the end of 2022. Economic agents are flexible, adaptable, and resilient. Economists and many policy-makers under-estimate the ability of the economy to adapt to shocks, figure things out, and move forward again. Supply chain resolution gets one-third of the credit for inflation coming down as rapidly as it did.
The US federal government provided about $5 trillion in emergency fiscal assistance to cushion the blow of the pandemic and the loss of 22 million jobs in March-April 2020. The massive fiscal stimulus came when the economy was producing well below capacity due to pandemic restrictions on travel, dining out, and tourism in general. Increase consumption demand when supply is constrained, well, that is classic economics 101 to create inflation. Fiscal spending is now roughly in line with pre-pandemic rates as a percent of nominal GDP. We give fiscal policy one-third credit for why the inflation surge reversed.
Our last factor is monetary policy. The zero rates and quantitative easing (i.e., asset purchases by the Fed) did not cause consumer price inflation in the decade before the pandemic. Zero Rates and QE caused asset price inflation -- big time. What mattered about monetary policy during the pandemic was that it was designed to support the massive fiscal emergency spending. When fiscal policy was incredibly accommodative, monetary policy was supporting it by not allowing the large increases in public debt issuance to have any impact whatsoever on bond yields. This was an inadvertant experiment with Modern Monetary Theory (or MMT), and as many had predicted, a combination of large fiscal stimulus supported by an easy monetary policy can produce inflation. The Fed gets one-third credit since it removed monetary accommodation during 2022.
The Fed often talks about having more work to do in getting inflation back to its 2% target is quite misleading. The phrase "having more work to do" gives the impression that the Fed thinks it deserves all the credit for the rapid decline in inflation. The Fed is powerful, but not that powerful. There are many other forces at play in the inflation calculus, and monetary policy is only one, if a very important piece of the puzzle.

Why Bayes? (June 1, 2024)
The Reverend Robert Thomas Bayes developed his ideas about how to update one's expectations back in the 1750s. His logic, often known as Bayesian Inference, is directly applicable to how we can analyze financial markets and economic activity.
Bayes argued that based on the information available and the ways in which one analyzed and processed information, one would form an expectation and hold that expectation with a certain degree of confidence. Then, one would receive new information, and one would revise one's own expections. New information that supported one's previous expectation might inspire greater confidence. New information that did not fit well with the prior expectation might result in a revised expectation as well as holding it with less confidence. That is, Bayes elegantly laid out how one took in new information and revised both expectations and confidence, which is exactly what happens with traders and investors.
Connect with Us
We are available for financial consulting assignments or for speaking engagements. Our contact information is as follows:
Blu Putnam on Linked-In: www.linkedin.com/in/bluputnam/
Bayesian Edge / P.O. Box 69 / Ridge, MD 20680 USA